
Retail Sales Rise 0.8 Percent in September: Why Gasoline Prices Drove Most of the Gain
A strong monthly retail sales number usually reads like good news about shoppers, but the September report shows how easily a headline can mislead. Most of the increase came from drivers paying more at the pump rather than from people buying more goods.
In this article, we will explore what the Commerce Department reported, how much of the gain came from gasoline, what the category detail says about household behavior, what economists are cautioning, and how shoppers and small sellers can plan for the holiday stretch.
The September Report in Numbers
The Commerce Department released its September retail sales figures on Thursday, October 15, 2026. According to the Associated Press, sales at retail stores, restaurants and online sellers rose 0.8 percent for the month. That followed a gain of 1.3 percent in August, a figure that was revised from its first estimate. Economists surveyed by FactSet had expected only a 0.3 percent increase, so on its face the report beat forecasts by a wide margin.
The more useful number sits one line lower. When gas stations are removed from the total, sales rose just 0.2 percent. That is below the 0.3 percent economists had penciled in for the headline, which tells you the underlying pace was soft even though the top-line figure looked robust. A reader who sees only “retail sales up 0.8 percent” will come away with the wrong idea about how freely Americans spent last month.
Another detail matters before anything else. The Commerce Department figures are not adjusted for inflation, which means they count dollars spent rather than goods bought. When prices climb, the same basket of goods can show up as higher sales even if no one carries an extra bag home. Inflation accelerated in September, so the report mixes real buying with the effect of higher prices, and it does not separate the two.
The table below collects the figures AP reported, so you can see the whole picture in one place.
| Measure | September result | Note |
| Total retail sales | Up 0.8 percent | Economists expected 0.3 percent (FactSet) |
| August total, revised | Up 1.3 percent | Revised from the first estimate |
| Sales excluding gas stations | Up 0.2 percent | Soft underlying pace |
| Gas stations | Up 6.4 percent | Main driver of the headline |
| Furniture and home furnishings | Up 1.3 percent | Strongest of the non-gas groups cited |
| Restaurants | Up 1.1 percent | Food service counts as retail here |
| Electronics and appliances | Up 0.6 percent | Modest gain |
| Online retailers | Up 0.3 percent | Slow for a channel that often leads |
| Clothing and accessories | Unchanged | No gain |
Keep in mind that this is a first look. Retail sales get revised, as August just showed, so the exact decimals may shift in later releases. The shape of the report, with a gasoline-heavy headline and a weak core, is the part worth remembering.
It also helps to know what the survey behind the number is. The Commerce Department asks a sample of retailers to report their sales, then scales the results to represent the whole country. Because it is a sample, early estimates carry some error, and revisions to earlier months are normal and not a sign that anyone made a mistake. The practical habit is to watch the direction across several months and not to react to a single decimal point.
Gasoline Did Most of the Lifting
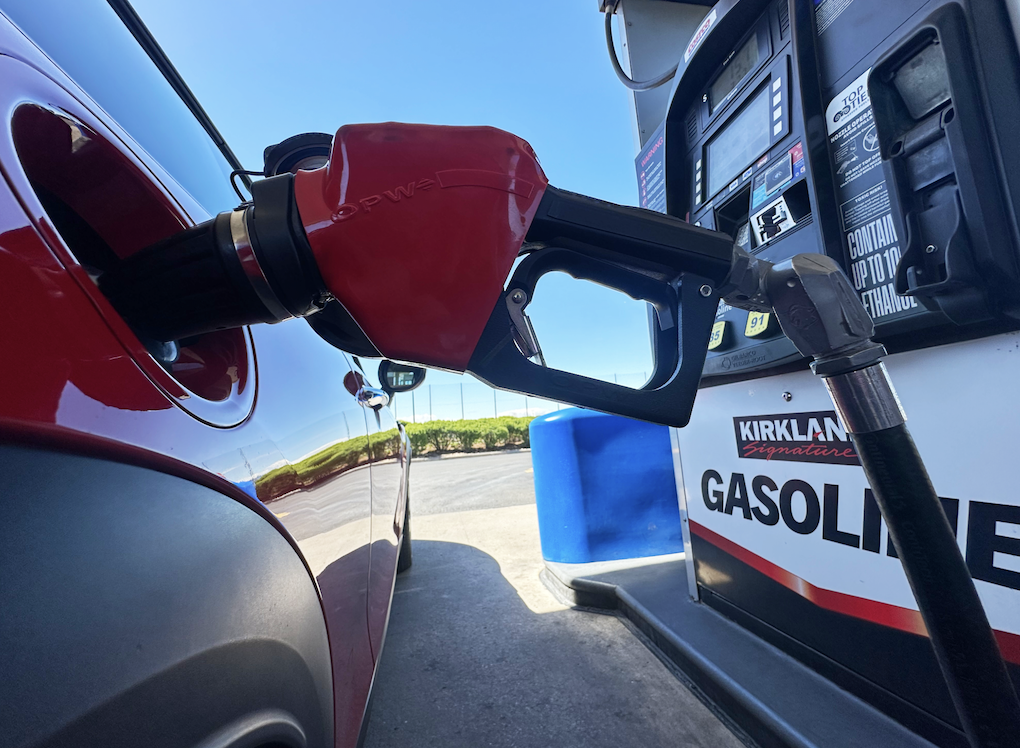
Gas stations posted the biggest jump of any category, up 6.4 percent in September according to AP. Because gasoline is a large and frequent purchase, a move that size shows up in the national total in a way a jump in, say, sporting goods would not.
A simple subtraction makes the point: the headline gain of 0.8 percent minus the 0.2 percent rise without gas stations leaves about 0.6 percentage points that trace back to fuel. That is roughly three-quarters of the whole increase. The subtraction is a rough tool and not an official breakdown, but it points firmly in one direction.
Why a Price Rise Looks Like a Sales Rise
Retail sales are measured in dollars received. If a station sells the same number of gallons at a higher price, receipts go up even though no one drove a single extra mile. This is why economists treat gas station sales as a price story first and a demand story second. A rise in the pump price transfers money from the driver to the station and the supply chain behind it, and the measurement records that transfer as more retail activity.
Researchers and forecasters often look at the total without gas stations, and sometimes without autos as well, for exactly this reason. Those cuts of the data are meant to filter out categories that are dominated by price swings or by big-ticket purchases. In September the filter did its job. It turned an apparently strong report into an ordinary one.
What Drivers Are Paying
AAA reported that the national average for a gallon of regular gasoline reached $4.33 on Thursday, October 15. AP noted that before the war began, gas cost less than $3 a gallon. The war is background here and not the subject of this article, but it is the backdrop for the prices drivers now see at the pump.
Here is an illustration with invented round numbers, not a forecast or a claim about any one household. Suppose a family fills the tank four times a month and each fill takes 12 gallons, for 48 gallons in all. At exactly $3 a gallon that costs $144 a month. At $4.33 it costs about $208, a difference of roughly $64 a month, or a little more than $760 over a year. Money that goes to the pump is money not available for furniture, restaurants or clothes, which is one reason the rest of the report looks muted.
There is another side to the same coin. Gasoline is a purchase most people cannot skip or postpone. A shopper can wait on a new sofa, but a commuter cannot wait on fuel, so a price rise there cuts directly into what is left for everything else. Economists call this a squeeze on discretionary income, and it tends to show up first in categories people can delay, such as clothing and apparel. That is one plausible reading of the flat apparel number, although a single month cannot prove it.
Why the Gas Figure May Differ Between Outlets
Different news outlets can report slightly different gas station percentages from the same release, because of rounding, revisions or which table they pull from. One other outlet reported a larger figure than AP did. In this article we rely on the AP number of 6.4 percent. If you are building a chart or a report of your own, pull the figure straight from the Commerce Department tables and note whether it is seasonally adjusted.
Categories Beyond the Pump
With fuel set aside, the rest of the report is a mixed bag. Some groups held up, a few grew modestly and one was flat. None of it looks like a spree. Reading across the categories gives a better sense of how households are choosing to spend when prices are climbing.
Home Furnishings and Electronics
Furniture and home furnishings rose 1.3 percent, the largest gain among the non-fuel groups AP cited. Electronics and appliances rose 0.6 percent. These are durable goods, bought less often and usually after some deliberation, so they respond to promotions and to the timing of a move or a repair. A single month of gains in these groups does not make a trend. Retailers often schedule big sales in the early fall, and shoppers who were waiting for a discount may have acted in September.
It is also worth remembering that appliances and furniture are among the items people replace when something breaks. Not every purchase in these categories is optional, which is one reason they can hold up when budgets feel stretched.
Restaurants and Online Sellers
Restaurants gained 1.1 percent, a healthy number. Eating out is one of the first things people trim when money is tight, so this figure is a point in favor of the view that many households are still willing to spend on experiences. At the same time, higher menu prices can lift receipts without adding meals, so some of this gain may be bigger checks and not more diners. The report cannot tell the two apart.
Online retailers rose only 0.3 percent. Online sellers often grow faster than stores, so a modest reading stands out. It could reflect shoppers holding back before the holiday sales, or it could reflect the shift toward spending on fuel and food. The report does not settle the question, and it would be a mistake to read much into one month of online data.
Clothing and What Is Missing
Clothing and accessories were unchanged. A flat reading for apparel is consistent with a household that has stopped adding to the closet while other costs rise. It also fits the picture of shoppers who wait for sales, a theme the economist quoted below raises directly.
One more limit deserves a mention. Travel and hotel stays are not included in the retail sales report, so the numbers say nothing about whether people are taking trips. Anyone using this release as a stand-in for the whole consumer economy is missing services such as lodging, medical care and education.
Nominal Dollars and the Inflation Problem
The report is stated in current dollars, and the same month brought a hotter inflation reading. AP noted that consumer prices rose 3.7 percent over the 12 months ending in September, with a 0.6 percent monthly gain. Those figures are covered in detail elsewhere. The point for retail sales is simple: when prices are rising at that rate, a dollar of sales buys less than it used to.
Economists handle this by deflating nominal sales to estimate real, or volume, growth. A rough way to think about it is to compare the sales growth for a category with the price growth for the goods in that category. If receipts at furniture stores rose 1.3 percent in a month in which furniture prices rose 0.5 percent, the volume of goods sold rose about 0.8 percent. This calculation is a general method and the 0.5 percent is an invented number for the example, since the retail report does not include a deflator.
Why the Year-Over-Year Figure Sounds Better Than It Is
A briefing from Ground News, which gathers reports from several outlets and is therefore a single aggregator source, put the year-over-year increase in retail sales at about 6.3 percent. That is a large number, but it is also a nominal one. When the price level is 3.7 percent higher than a year ago, and fuel is far higher than that, a good share of the 6.3 percent is simply price. Treat it as reported by that briefing only, and compare it with your own sources before quoting it.
Wages and Paychecks
The second half of the inflation problem is income. Natalie Kotlyar of BDO told AP that strong sales cannot last if paychecks keep lagging behind prices. That is a plain statement of how consumer spending works. Households can spend more than they earn for a while by drawing down savings or borrowing, but both have limits. When wage growth runs behind price growth, real purchasing power shrinks even if the number of dollars in the account rises.
What the Economists Are Saying
AP quoted two economists whose views are worth reading side by side, because they agree on the main point and differ in emphasis. Both reject the idea that September showed a burst of consumer strength.
Michael Pearce on the Gasoline Effect
Michael Pearce of Oxford Economics wrote that “The large jump in headline retail sales in September was almost entirely due to rising gasoline prices.” That matches the simple subtraction above. Pearce also said spending is on track for 3.3 percent annualized growth in the third quarter, which is a solid pace. But he expects momentum to fade as the holiday season approaches. His view is a forecast, not a fact, and it is one economist’s judgment, but it is a useful marker of how professional forecasters are reading the data.
The 3.3 percent figure and the weak core retail number can both be true. Quarterly consumer spending includes services, such as health care, travel and housing, that the retail sales report leaves out. A quarter can look healthy overall while goods spending is losing steam.
Natalie Kotlyar on Stretched Budgets
Kotlyar of BDO cautioned readers not to take the report as a sign of broad consumer strength. She said many shoppers are “leaning on savings and promotions to stretch their budgets.” The phrase is worth unpacking. Leaning on savings means households are spending money they set aside earlier, which can only continue until the cushion runs low. Leaning on promotions means they are waiting for discounts, which squeezes retailer margins.
Her advice to retailers was practical: protect margins and keep inventory flexible for November and December. Flexible inventory means avoiding large commitments on goods that may need heavy markdowns, and being able to reorder quickly if a product takes off. That is sensible guidance for any seller, and especially for small businesses that cannot absorb a pile of unsold stock.
Where the Two Views Agree
Both economists point at the same risk: spending that is propped up by prices, savings and discounts is fragile. Neither predicted a collapse, and neither should be read that way. What they describe is a consumer who is still active but increasingly selective, and a gap between the headline and the details that should make readers cautious.
For readers who follow markets, the practical takeaway is to avoid treating one strong headline as a reason to change plans. A report that beats expectations because of fuel prices says little about corporate profits at stores, and it can even point the other way, since higher gas costs and heavier discounting both squeeze margins. For readers who simply watch their own budgets, the message is easier: the economy can look busy on paper while individual households feel pinched, and both things can be true at once.
Signs of Stretched Household Budgets
Beyond the retail report itself, the Ground News briefing gathered several other indicators that fit the picture. Each of these comes from that single aggregator briefing, so treat them as reported rather than independently confirmed here.
Department Stores and the Beige Book
The briefing said department store sales rose 1.6 percent in September. That is a small gain, and it fits the idea of cautious shoppers in categories that rely heavily on discounting. The same briefing noted that the Federal Reserve’s Beige Book, a periodic collection of anecdotal reports from businesses around the country, described little or no change in overall consumer spending.
The Beige Book is not a statistic. It is a summary of what businesses and contacts told regional Federal Reserve banks. When it describes flat spending while a sales report shows a jump, the gap is a sign that price effects, not volume, produced the strong number.
Buy Now, Pay Later
The briefing also reported that use of buy now, pay later plans has increased, and that nearly one in five households faces repayments above $500. Buy now, pay later lets a shopper split a purchase into a few installments, often without interest if the payments are made on time. It can be a convenient budgeting tool when used for a planned purchase. It can also make spending feel cheaper than it is, because the cost is spread out and the total is easy to lose track of.
If that figure is accurate, it means a large group of households is already committing part of next month’s income. That limits how much more they can spend this holiday season. It is one more reason to treat the strong September headline with caution. Check the original source before relying on the one-in-five figure, since a briefing that collects other outlets’ reports can compress details.
Reading Retail Sales as a Consumer or a Seller
The retail sales release is a tool. Used well, it helps you decide when to buy, how much to stock and how worried to be. Used carelessly, it produces false confidence or needless alarm. A few habits help.
Always Ask What Is in the Number
Start with the headline, then immediately find the version without gas stations, and without autos if the release provides it. If the two numbers differ greatly, as they did here, the headline is telling you more about prices than about demand. Then check the categories most relevant to you. A furniture seller should care about home furnishings, a restaurant owner about food service and a clothing brand about apparel.
Compare With Prices and Wages
Next, set the sales growth beside the inflation rate. Sales growth that is lower than price growth means real volume is shrinking. Then look at wage growth. If paychecks are growing slower than prices, the situation Kotlyar described, consumer demand is being financed by something other than income, and that has a limited life.
Remember What Is Left Out
Services are absent. So are travel and hotels. A report that covers goods and restaurants gives a partial reading of consumer health, so pair it with other data such as the monthly spending report, jobs numbers and survey measures of confidence. No single release tells the whole story.
One last habit is worth building: look at the revisions. August began as one number and ended as a revised 1.3 percent gain. If the revised figures tend to come in higher or lower than the first estimates for several months in a row, that pattern is a clue about momentum that the first headline cannot give you. Keeping a simple running note of first and revised readings takes a few minutes a month and makes each new release easier to judge.
Holiday Planning for Shoppers and Sellers
For shoppers, the main lesson is that your own budget matters more than any headline. For small sellers, the lesson is to prepare for a cautious customer. The following steps are general suggestions and not financial advice, and your own circumstances may call for something different.
For Shoppers
Set a holiday budget now, before the sales begin, and write it down. Decide how much you can spend without touching savings or running up a balance. If you use buy now, pay later plans, add up all your outstanding installments before taking on another, because several small payments can add up to a large monthly obligation.
Plan around fuel costs. If the pump price is taking a bigger bite out of your month, consider combining errands, shopping online for bulky items where shipping is free or planning trips to avoid extra driving. Compare prices across stores and use price-tracking features when they are available. Waiting for a discount works, but only if you were going to buy the item anyway. A markdown on something you do not need is still a cost.
For Small Retailers and Restaurants
Keep inventory flexible, as Kotlyar advised. Order smaller quantities of seasonal goods and reorder if they sell. Negotiate return terms with suppliers where you can. Watch your margins carefully, since promotions that bring customers in can leave little profit if your own costs are rising.
Think about how fuel prices affect your customers. A restaurant near a commuter route may see fewer visits if driving feels expensive. A retailer that offers local delivery may want to review its route planning. Small adjustments to hours, menus or shipping thresholds can matter when margins are thin.
A Short Checklist
| Step | Why it helps |
| Write a holiday budget before sales start | Keeps promotions from setting the spending level |
| Total up all buy now, pay later installments | Shows the real monthly commitment |
| Compare fuel-heavy trips with online orders | Reduces driving costs when shipping is free |
| Buy only items you already planned to buy | Discounts on unplanned items still cost money |
| Sellers: stage inventory orders | Limits markdown risk if demand cools |
| Sellers: check margins on promotions | Prevents sales that lose money |
Frequently Asked Questions
How Much Did Retail Sales Rise in September 2026?
According to the Commerce Department figures reported by the Associated Press, retail sales rose 0.8 percent in September. That followed a revised 1.3 percent gain in August. Economists had expected about 0.3 percent for September.
Why Did Retail Sales Jump if Consumers Are Struggling?
Most of the jump came from higher gasoline prices, which raise gas station receipts without adding to the number of goods sold. Without gas stations, sales rose just 0.2 percent. Higher prices in general also inflate the dollar total.
Are Retail Sales Numbers Adjusted for Inflation?
No. The figures reported for September are not adjusted for inflation, so they reflect dollars spent and not volume of goods bought. Economists compare them with price data to estimate real growth.
What Was the National Average Gas Price in Mid-October?
AAA reported that the average for regular gasoline reached $4.33 a gallon on Thursday, October 15. AP noted that before the war began, gas cost less than $3. Prices vary by state and change daily, so check a current source.
Does the Retail Sales Report Include Travel and Hotels?
No. Travel and hotel stays are not part of the report, which covers stores, restaurants, online sellers and gas stations. For services like lodging you would need other data.
Will Holiday Spending Stay Strong?
Nobody can say for sure. Oxford Economics’ Michael Pearce expects momentum to fade into the holidays, and BDO’s Natalie Kotlyar warned that strong sales cannot last if paychecks keep lagging prices. Those are forecasts, not certainties.