How to Read a Price History Chart to Tell Whether a Discount Is Real
Online shopping makes it easy to find attractive discounts. However, not every sale offers genuine savings. Some retailers increase original prices before announcing massive discounts. Consequently, shoppers may pay more than an item’s usual price.
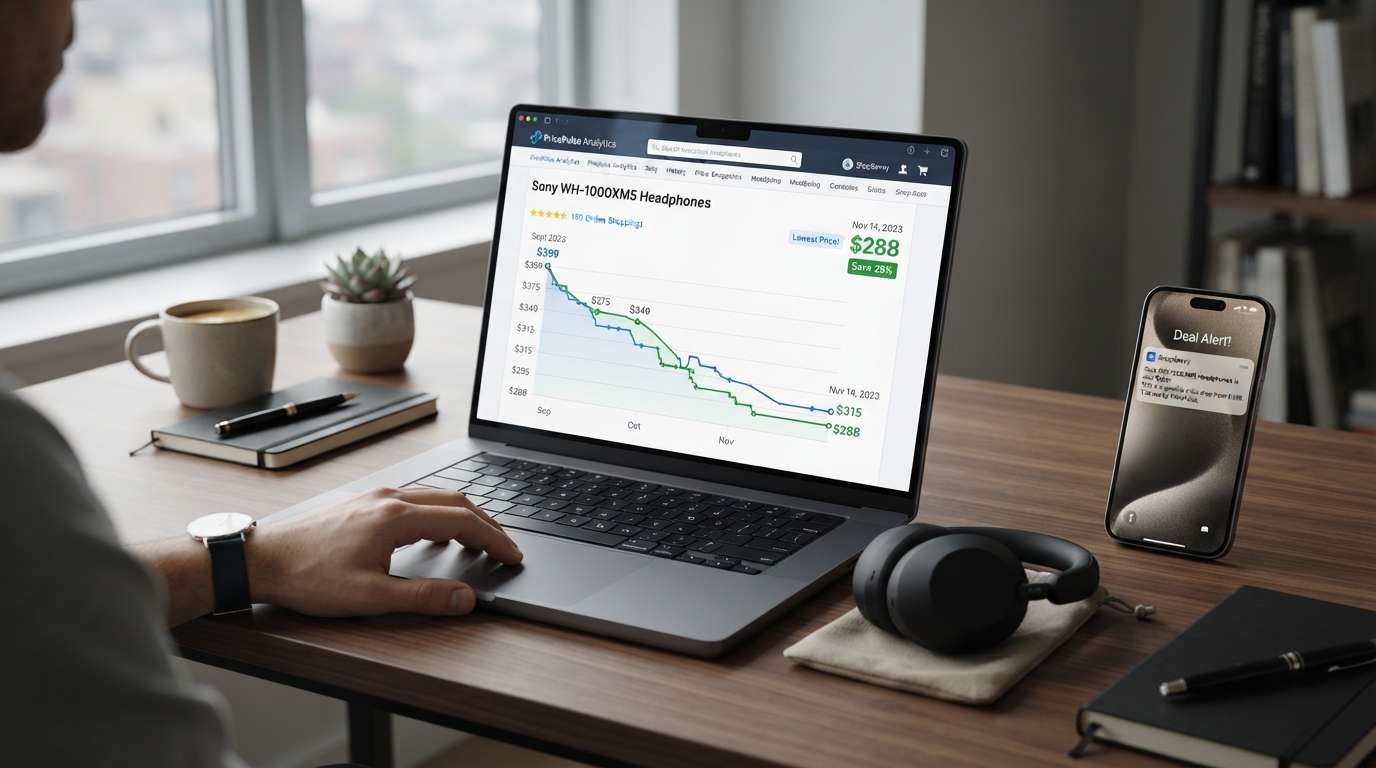
A price history chart helps you identify these misleading offers. It shows how a product’s price changes over time. Therefore, you can compare today’s price with previous prices before purchasing.
What Is a Price History Chart?
A price history chart tracks a product’s selling price over a specific period. Most tools display historical prices through a simple line graph.
The horizontal axis represents time. Meanwhile, the vertical axis shows the product’s price.
For example, a laptop might cost $1,000 in January. Its price could drop to $850 in March. Later, the retailer might advertise it for $799.
At first glance, this looks like an excellent discount. However, historical data reveals whether $799 represents genuine savings.
Why Price History Matters When Shopping Online
Retailers frequently promote limited-time offers and seasonal sales. However, promotional labels don’t always reflect actual savings.
A price history chart helps shoppers:
- Identify artificially inflated original prices.
- Compare current prices with historical averages.
- Recognize genuine seasonal discounts.
- Avoid misleading promotional campaigns.
- Find better opportunities before purchasing.
Moreover, historical pricing helps you avoid unnecessary spending. Instead of rushing into purchases, you can make informed decisions.
How to Read a Price History Chart Step by Step
Understanding a price chart doesn’t require financial expertise. You only need to examine several important details.
1. Check the Previous Selling Price
Start by examining the product’s historical prices. Look at its regular selling price before the current promotion.
For instance, imagine a retailer advertises headphones for $60. The displayed original price is $100.
However, the chart shows the headphones regularly sold for $65. Therefore, the actual discount is only $5.
This comparison immediately exposes misleading discount claims.
2. Compare the Current Price With Historical Averages
Next, examine the product’s typical price over several months.
A genuine discount usually falls below its normal selling range. However, a small temporary reduction doesn’t necessarily represent exceptional value.
For example:
- Average historical price: $120
- Previous lowest price: $95
- Current promotional price: $85
This offer looks attractive because it beats the previous recorded low.
Nevertheless, check the product’s condition and seller before purchasing.
3. Identify Sudden Price Increases
Sudden price increases deserve particular attention.
Some retailers raise prices shortly before launching promotional campaigns. Consequently, their advertised discounts appear larger than actual savings.
Suppose a product normally costs $150. Its price suddenly increases to $200 before a major sale.
The retailer then advertises a 25% discount. However, the final price remains $150.
Therefore, shoppers haven’t received any meaningful savings.
4. Look for Seasonal Price Patterns
Product prices often change throughout the year. Electronics, appliances, clothing, and household products experience seasonal demand.
For example, televisions frequently receive promotional pricing during major shopping events. Similarly, winter clothing may become cheaper toward spring.
Therefore, compare prices across similar shopping seasons.
A chart covering twelve months can reveal useful patterns. However, longer historical records provide additional context.
5. Check the Lowest Recorded Price
The lowest recorded price provides another useful comparison.
However, don’t assume every historical low represents a realistic buying opportunity. Some prices result from temporary promotions, clearance sales, or pricing errors.
Instead, compare three figures:
- Current selling price.
- Lowest recorded price.
- Typical historical price.
Together, these figures help you evaluate the offer more accurately.
Best Tools for Checking Product Price History
Several online tools help shoppers track historical product prices. Their availability depends on the retailer and supported marketplaces.
CamelCamelCamel
CamelCamelCamel tracks Amazon product prices over time. It displays historical pricing information and helps shoppers identify potential discounts.
Furthermore, users can create price alerts for selected products.
Keepa
Keepa provides detailed Amazon price tracking charts. It displays historical price movements and supports price-drop notifications.
Additionally, shoppers can compare different pricing categories when available.
Google Shopping
Google Shopping helps consumers compare prices across multiple retailers. Its price insights can also provide historical pricing information for supported products and regions.
However, available tracking features vary by product and market.
Common Mistakes to Avoid When Checking Discounts
Even useful price history tools can produce misleading conclusions when shoppers interpret information incorrectly.
Ignoring Shipping and Additional Costs
A product might appear cheaper at one retailer. However, shipping fees, taxes, and additional charges can increase its final cost.
Therefore, always compare the complete checkout price.
Trusting Extremely Short Price Histories
A chart covering only a few days provides limited information. Consequently, it may hide previous price increases or seasonal patterns.
Whenever possible, examine several months of historical data.
Comparing Different Product Versions
Two products might share similar names but include different specifications.
For example, laptops can have different processors, storage capacities, and memory configurations.
Therefore, compare the exact product model before evaluating discounts.
Ignoring Seller Reputation
A low price doesn’t automatically guarantee a safe purchase. Some unfamiliar sellers advertise unrealistic discounts to attract customers.
Check seller ratings, return policies, warranties, and customer reviews before ordering.
How to Calculate Whether a Discount Is Genuine
You can calculate the actual discount using a simple formula:
Discount Percentage = [(Regular Price − Current Price) ÷ Regular Price] × 100
Consider a product with a regular price of $200. Its current selling price is $160.
The calculation becomes:
($200 − $160) ÷ $200 × 100 = 20%
Therefore, the actual discount is 20%.
However, use the product’s typical historical price instead of an inflated reference price. This approach provides a more realistic picture of your savings.
Final Thoughts
Reading a price history chart helps shoppers recognize genuine discounts. It also exposes misleading promotional strategies and unnecessary price increases.
Before purchasing, examine historical averages, previous lows, and sudden price changes. Additionally, compare different retailers and include shipping costs.
Most importantly, avoid rushing into limited-time offers. A little research can protect your budget and help you find better deals.